

Bitcoin (BTC) has recently suffered a significant fall, influenced by global events that affected the financial market. In the 4 -hour chart, we observe movements that reflect this volatility.
Yesterday (2) US President Donald Trump announced the imposition of 25% rates on imports in Mexico and Canada, and 10% on Chinese products.
These measures have generated concerns about a possible global trade war, leading investors to undo risk assets, including cryptocurrencies. As a result, Bitcoin fell below $ 100,000, reaching a minimum of $ 91,441.89
Technical Analysis: Main Support Levels and Resistance
In the 4 -hour chart, Bitcoin presents the following critical points:
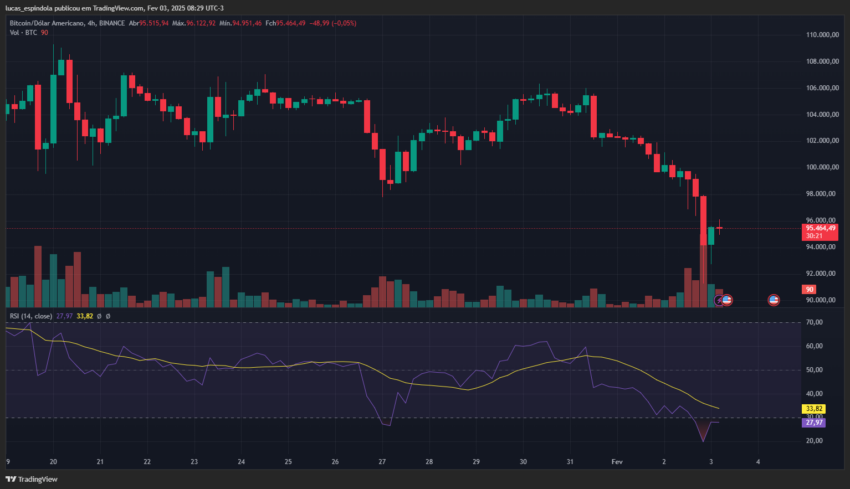
- Resistance: US $ 95 thousand
- Support: US $ 91,500
Bitcoin’s current price is US $ 95,460, with a variation of -3.64% over the previous closure. The maximum intraordinary value was $ 99,393, while the minimum reached $ 91,995.
BTC RSI in Neutral Zone
The Relative Strength Index (RSI) is a technical indicator that measures the speed and change of price movements. It varies from 0 to 100, and values above 70 indicate overcomparance and below 30, overwheliness.
Currently, the Bitcoin RSI is in 45, suggesting a neutral condition, with no clear signs of overcomparance or overpowered.
Future Perspectives: What to expect from Bitcoin?
The recent volatility highlights Bitcoin’s sensitivity to macroeconomic events. Investors should closely monitor global commercial tensions and technical levels mentioned to make informed decisions.
Exemption from liability
All information contained on our site is published in good faith and only for general information purposes. Any action that the reader takes based on the information contained on our site is at his own risk.